Guide · 2 August 2026
How to trace AI agents you already run
You have an agent in production. It runs in your own infrastructure, on LangChain, the OpenAI Agents SDK, the Vercel AI SDK or plain code. You want to see what it does on every run without rewriting it.
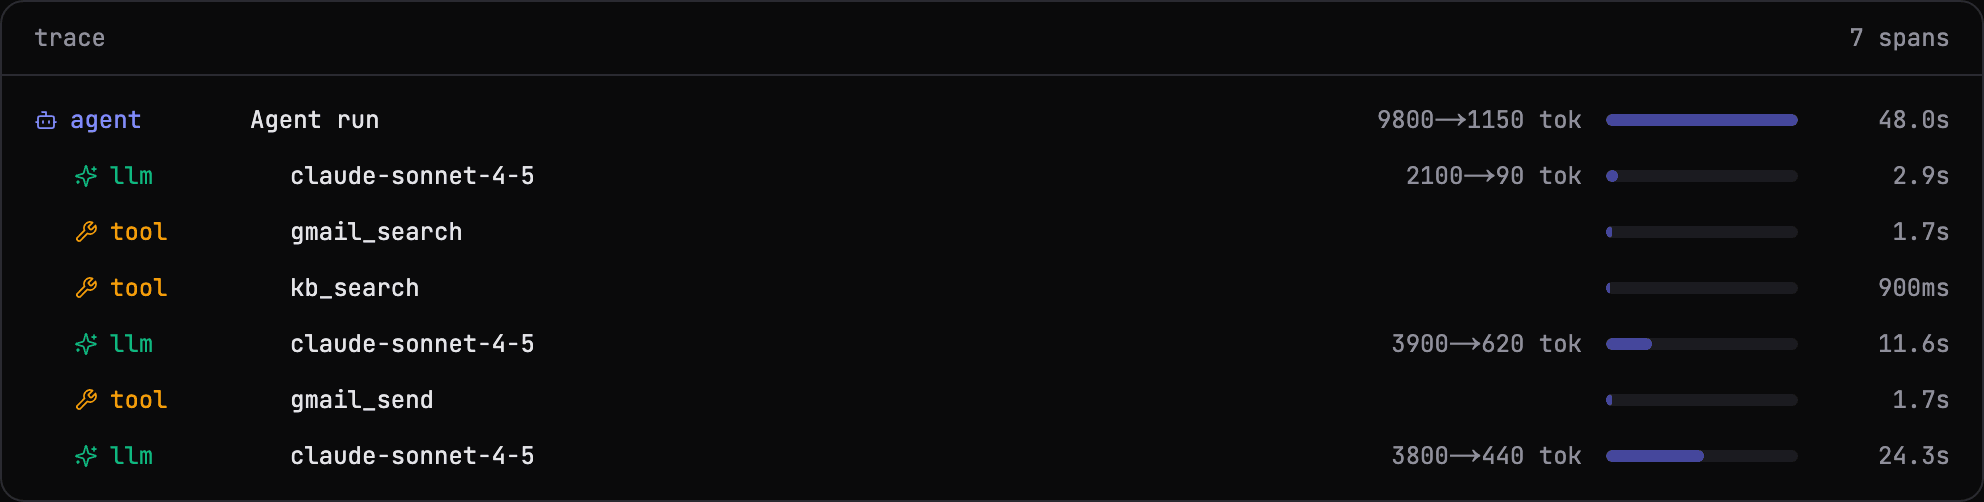
A trace is the answer: a tree of timed steps for each run (the run, each step, each model call, each tool call) with durations and token counts on every node. This guide shows three ways to get one into AgentOS, from least to most setup.
1. Already on OpenTelemetry? Change the endpoint
Many agent frameworks already emit OpenTelemetry GenAI spans. If yours does, you don't need any AgentOS code. Point the exporter at AgentOS:
export OTEL_EXPORTER_OTLP_TRACES_ENDPOINT="https://agentos-ai.dev/api/ingest/v1/traces"
export OTEL_EXPORTER_OTLP_TRACES_HEADERS="Authorization=Bearer <your AgentOS key>"
export OTEL_EXPORTER_OTLP_PROTOCOL="http/json"
Each trace becomes a run. Spans keep their parent and child structure, gen_ai.request.model names the model call, token usage becomes the run's token count, tool spans become tool calls, and an error status on the root span marks the run as failed.
Two details to get right: the exporter must send JSON (http/json), and with a workspace key you set agentos.agent_id on the OpenTelemetry resource so the trace lands on the right agent. With an agent key there is nothing else to set.
2. Wrap your code with the SDK
If the agent is plain code, wrap each run and the steps inside it. Spans are timed and nest.
import { AgentOS } from "@agentos-sdk/core";

const aos = new AgentOS(); // reads AGENTOS_API_KEY and AGENTOS_AGENT_ID

await aos.withRun(async (run) => {
  const step = run.startSpan("classify email", { kind: "step" });
  const llm = step.child("gpt-4.1", { kind: "llm" });
  // ... call the model ...
  llm.end({ input_tokens: 1240, output_tokens: 90 });
  step.end();
});
The Python SDK has the same shape:
from agentos import AgentOS

aos = AgentOS()  # reads AGENTOS_API_KEY and AGENTOS_AGENT_ID

with aos.start_run() as run:
    step = run.start_span("classify email", kind="step")
    llm = step.child("gpt-4.1", kind="llm")
    # ... call the model ...
    llm.end({"input_tokens": 1240, "output_tokens": 90})
    step.end()
Token counts on a span show on that span. For cost, pass the run's total token usage when you complete it (run.complete({ usage })), and cost adds up per run and per agent.
3. Or run the agent on AgentOS
Agents that run on AgentOS are traced with no setup: every run gets a root span, a span per model call and a span per tool call, with durations and token usage. That is the option with the most visibility and the least code, if moving the agent is on the table.
What you get
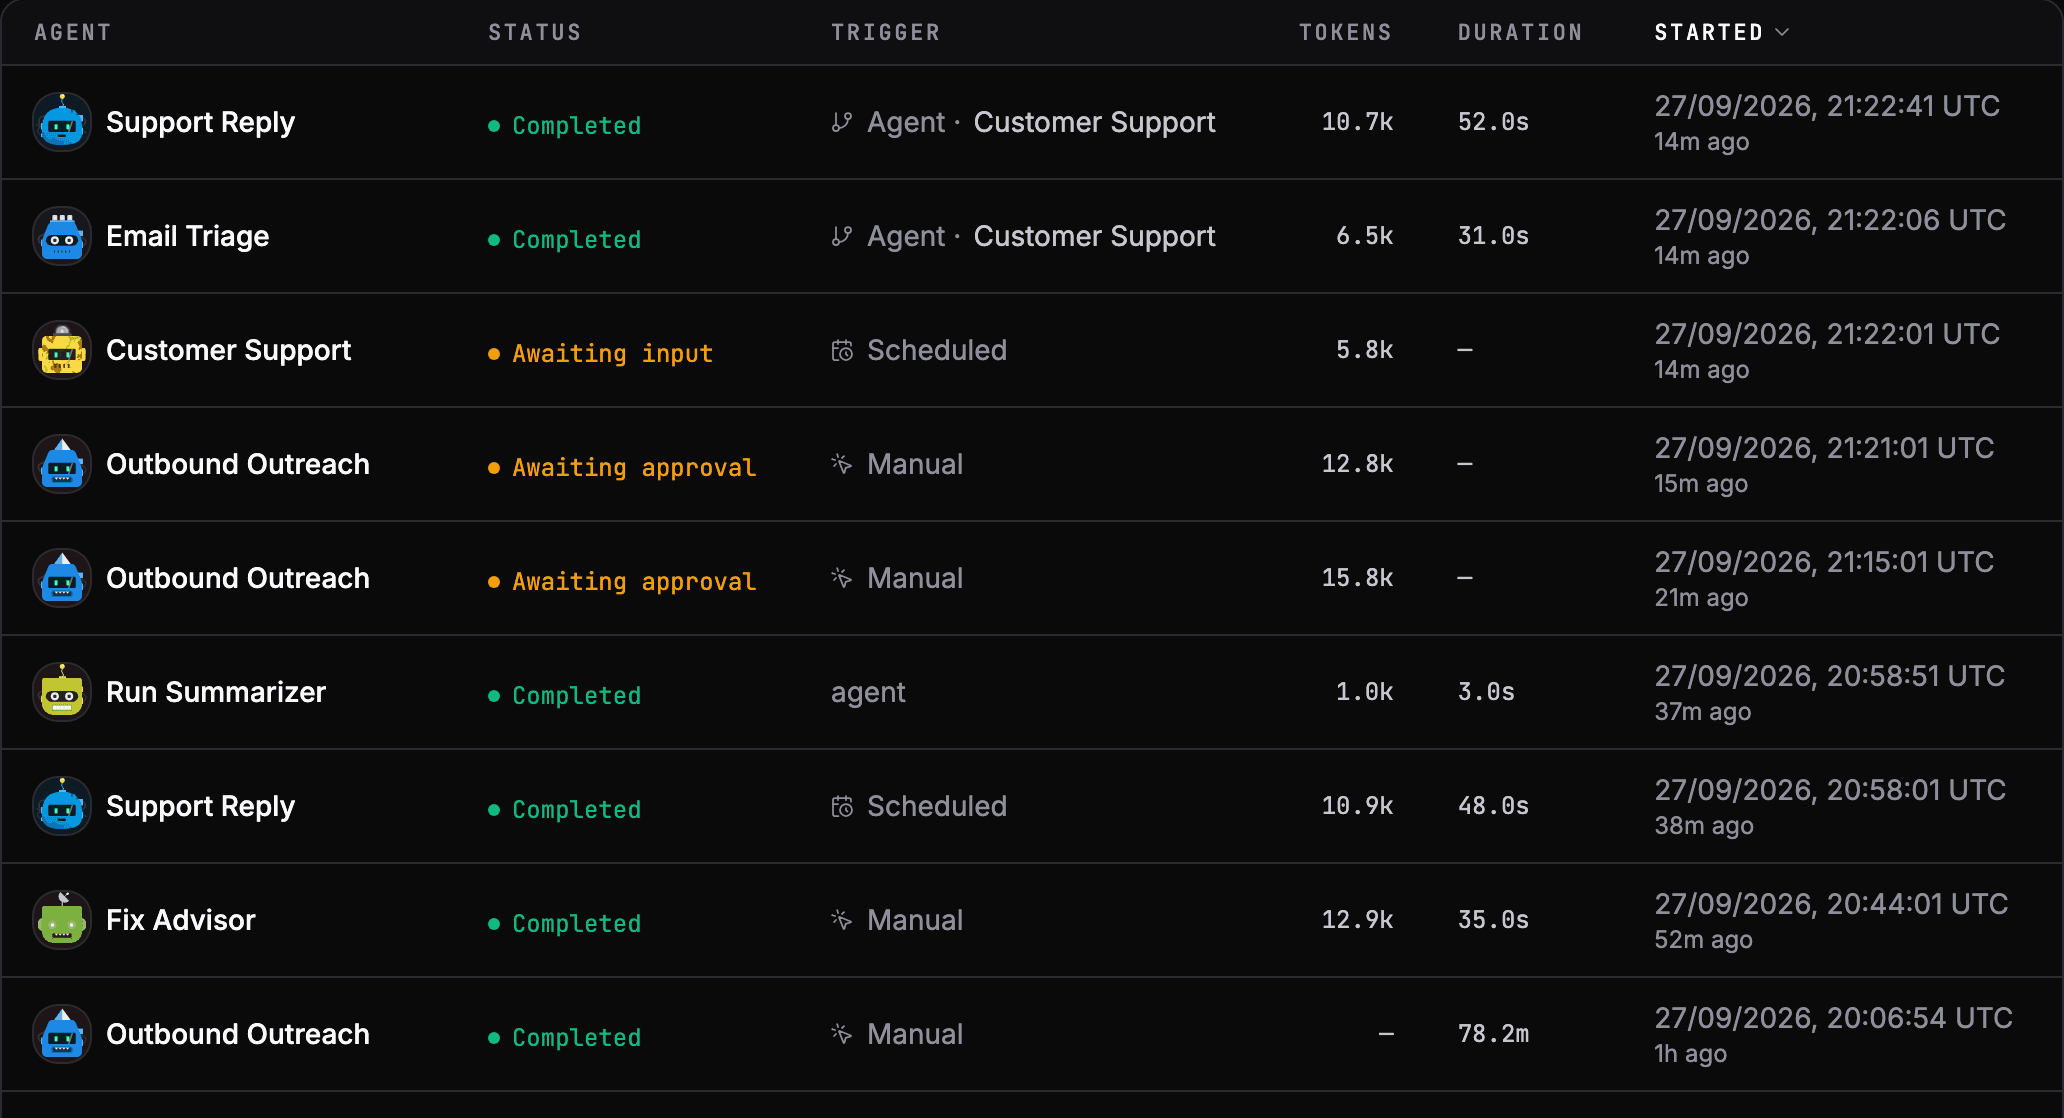
However the trace arrives, the run shows up in the same place:
- The run list, with status, trigger, duration and tokens for every run.
- The trace view, where the time and the tokens went, step by step.
- Cost by agent and by model, from each run's token counts.
- Alerts on failures, slow runs and spend.
The tracing docs have the full OpenTelemetry mapping and limits, and the TypeScript and Python SDK references cover the rest of the API.
See your own agents like this
AgentOS records every run, pauses risky actions for approval, and tells you when an agent breaks.